Head and Shoulders Pattern Explained: Meaning, Identification & Trading Tips
- What is the Head and Shoulders Pattern?
- Key Components of the Pattern
- Is Head and Shoulders Bullish or Bearish?
- Identifying Head and Shoulders in Stock Charts and Forex
- Head and Shoulders Candle Pattern Analysis
- Trading the Head and Shoulders Pattern
- Head and Shoulders in Forex Trading
- Common Mistakes to Avoid
- Conclusion
The head and shoulders pattern is one of the most reliable reversal formations in technical analysis, signaling a potential trend change from bullish to bearish in financial markets. This classic chart pattern appears across all timeframes and asset classes, making it essential knowledge for forex traders and investors alike.
What is the Head and Shoulders Pattern?
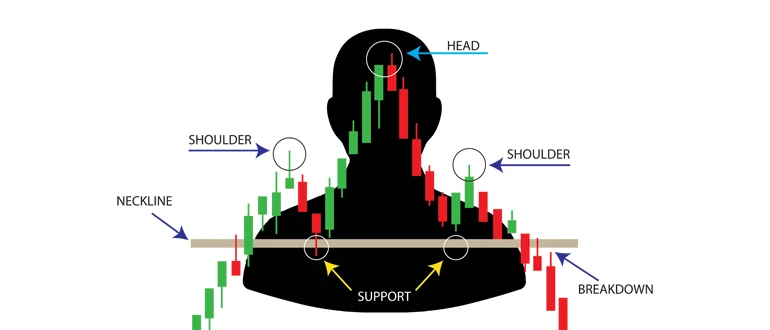
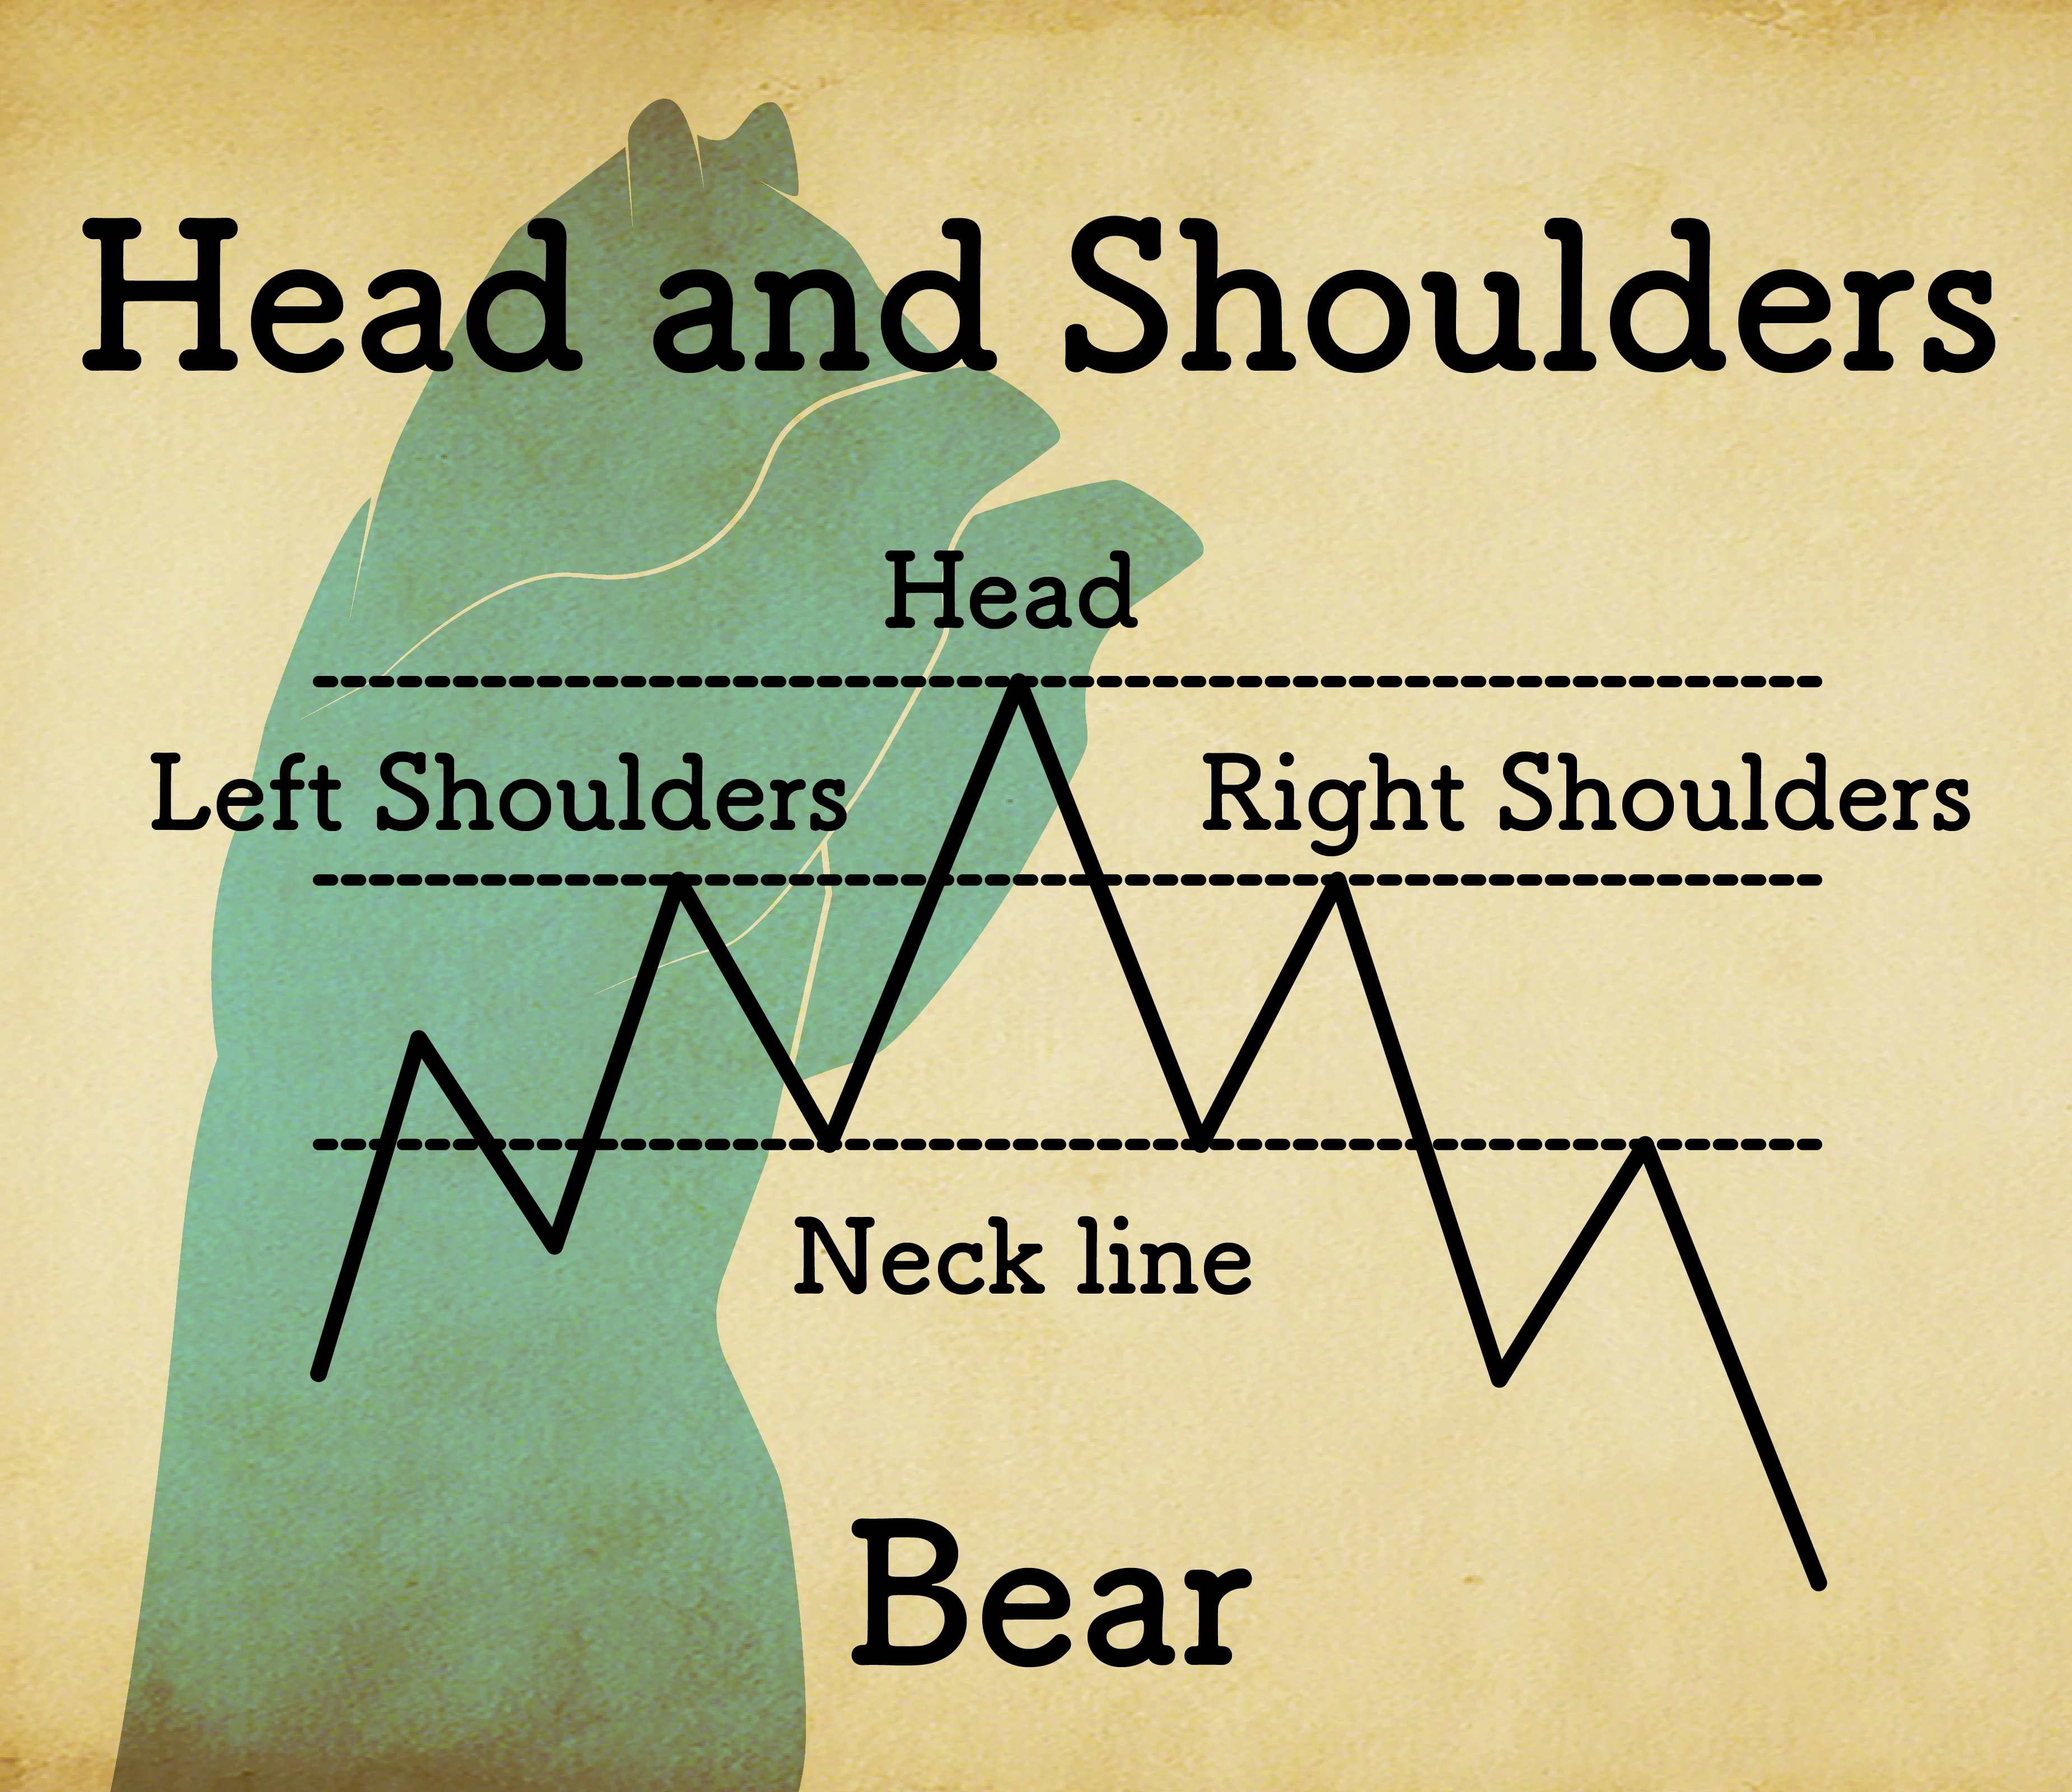
The head and shoulders pattern consists of three peaks: a left shoulder, a higher central peak (the head), and a right shoulder that's roughly equal in height to the left shoulder. The pattern is connected by a neckline drawn through the lowest points between the peaks. This formation typically develops at the end of an uptrend, indicating that buying pressure is weakening and a bearish reversal may be imminent.
Key Components of the Pattern
Left Shoulder: The first peak forms during the existing uptrend, followed by a pullback to create the first low point of the neckline.
Head: The central and highest peak represents the final push higher before momentum begins to fade. The subsequent decline creates the second point of the neckline.
Right Shoulder: The final peak, typically lower than the head and similar in height to the left shoulder, confirms weakening bullish momentum.
Neckline: The support level connecting the lows between the shoulders and head. A decisive break below this line confirms the pattern.
Is Head and Shoulders Bullish or Bearish?
The traditional head and shoulders pattern is decidedly bearish. It signals the end of an uptrend and the beginning of a potential downtrend. However, traders should also be aware of the inverse head and shoulders (or head and shoulders bottom), which appears at market bottoms and indicates bullish reversal potential.
Identifying Head and Shoulders in Stock Charts and Forex
Volume Confirmation: In stock charts, volume typically decreases with each successive peak, confirming weakening buying interest. The volume should increase significantly when the neckline breaks.
Timeframe Considerations: The pattern works across multiple timeframes, from intraday charts to weekly and monthly views. Longer timeframes generally provide more reliable signals.
Market Context: The pattern is most effective when it appears after a sustained uptrend. Premature pattern recognition in choppy or sideways markets can lead to false signals.
Head and Shoulders Candle Pattern Analysis
When analyzing the head and shoulders candle pattern, pay attention to:
- Candlestick formations at each peak, particularly reversal patterns like doji, hanging man, or shooting star
- Price rejection at key resistance levels during the formation of the head
- Decreasing momentum evidenced by smaller real bodies and longer wicks in subsequent peaks
Trading the Head and Shoulders Pattern
Entry Strategy: Wait for a confirmed break below the neckline with increased volume before entering short positions. Premature entries can result in false breakouts.
Stop Loss Placement: Set stop losses above the right shoulder or the most recent swing high to protect against pattern failure.
Price Target: Calculate the distance from the head to the neckline and project this measurement below the breakout point. This provides a conservative profit target.
Risk Management: Never risk more than 1-2% of your trading capital on a single trade, regardless of pattern confidence.
Head and Shoulders in Forex Trading
The head and shoulders forex pattern is particularly valuable in currency trading due to:
- High liquidity ensuring clean breakouts and reduced false signals
- 24-hour market providing multiple opportunities across different sessions
- Economic fundamentals often aligning with technical patterns during major trend reversals
- Multiple timeframe analysis allowing traders to confirm patterns across various charts
Common Mistakes to Avoid
Avoid forcing the pattern when market structure doesn't clearly support it. Ensure adequate volume confirmation in stock trading, and consider fundamental factors that might override technical signals. Remember that not all head and shoulders formations lead to significant reversals.
Conclusion
The head and shoulders pattern remains a cornerstone of technical analysis, offering traders a systematic approach to identifying potential trend reversals. Success requires patience, proper risk management, and confirmation through multiple technical indicators. Whether trading stocks or forex, mastering this pattern can significantly enhance your market timing and overall trading performance.