Inverse Head and Shoulders Pattern: Complete Bullish Reversal Guide
- What Is the Inverse Head and Shoulders Pattern?
- Anatomy of the Pattern
- The Psychology Behind the Pattern
- Volume Confirmation
- How to Trade the Inverse Head and Shoulders Pattern
- Setting Stop-Loss Levels
- Calculating Price Targets
- Timeframes and Reliability
- Common Variations and Considerations
- Integration with Other Technical Tools
- Risk Factors and Limitations
- Real-World Applications
- Conclusion
In the world of technical analysis, few chart patterns command as much respect and attention as the inverse head and shoulders formation. This powerful bullish reversal pattern serves as a beacon for traders seeking to identify potential trend changes from bearish to bullish market conditions. Understanding how to recognize, interpret, and trade this pattern can significantly enhance your trading arsenal and help you capitalize on major market turning points.
What Is the Inverse Head and Shoulders Pattern?
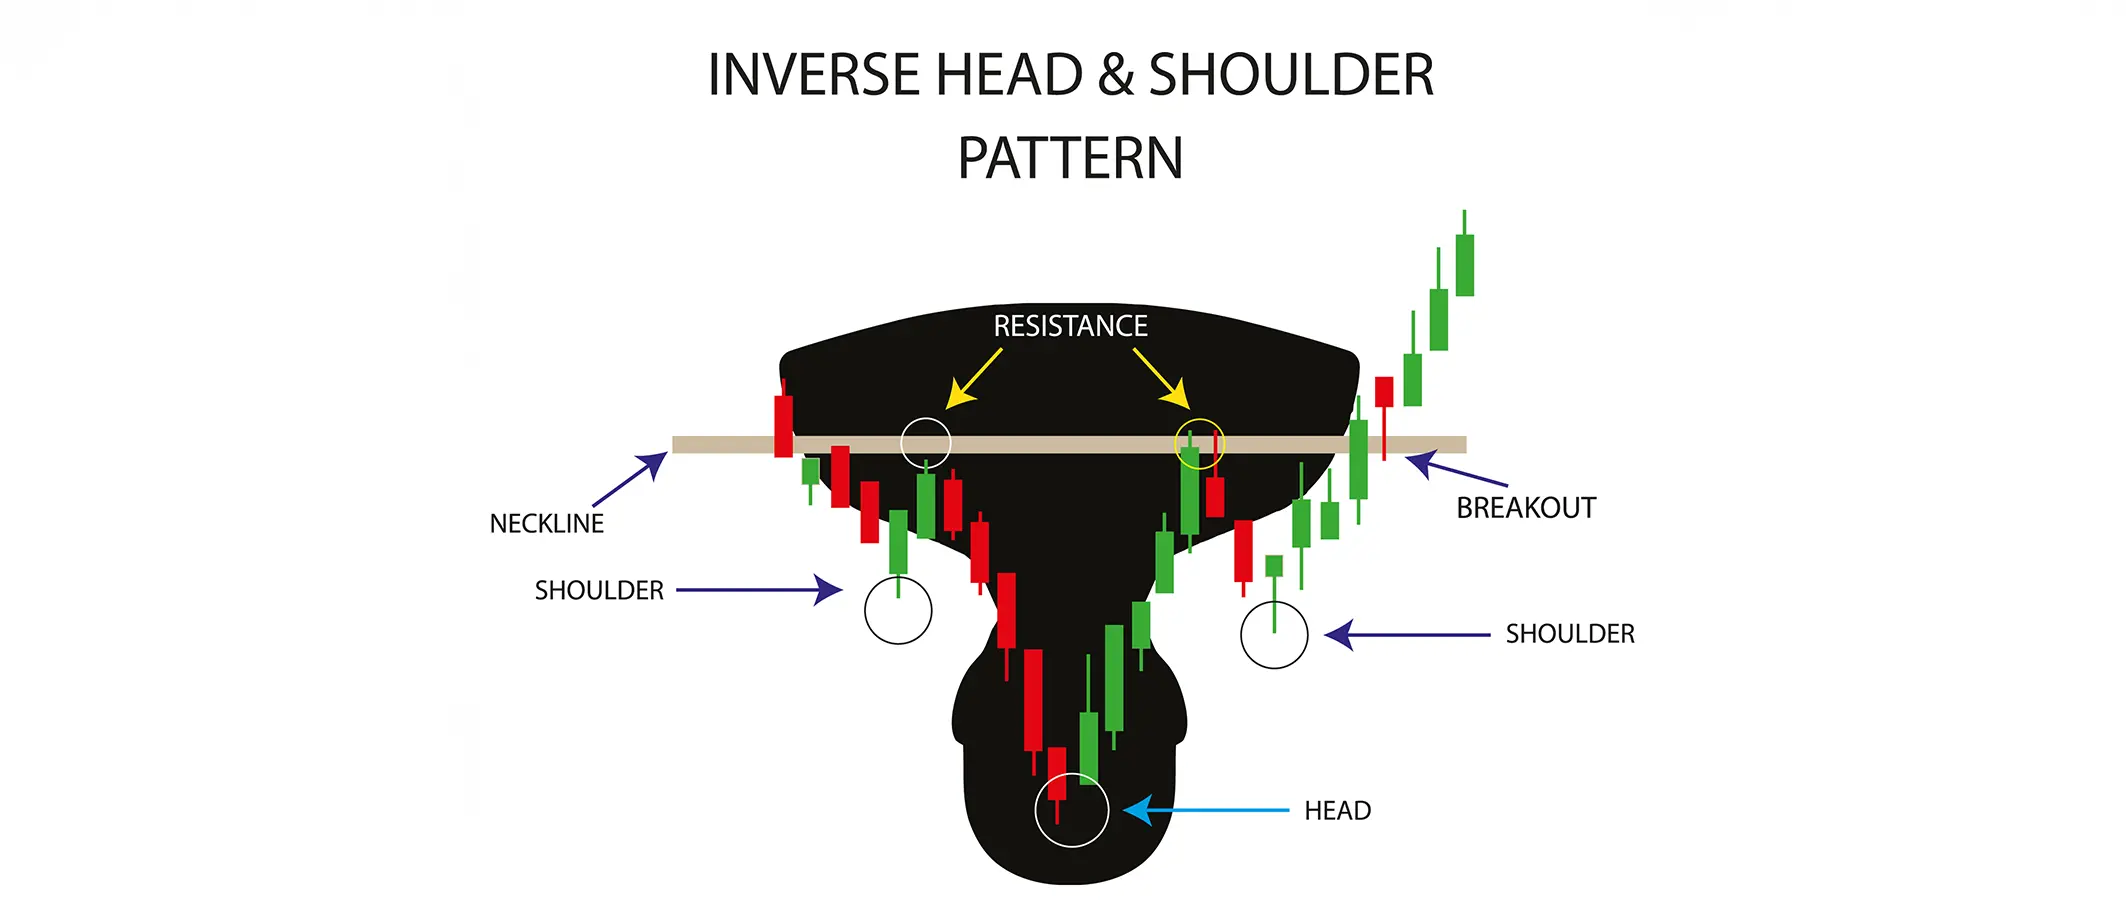
The inverse head and shoulders pattern, also known as the head and shoulders bottom, is a chart formation that signals a potential reversal from a downtrend to an uptrend. This pattern appears after a sustained period of declining prices and consists of three consecutive troughs, with the middle trough (the head) being the lowest point, flanked by two higher troughs (the shoulders) that are roughly equal in depth.
The pattern derives its name from its distinctive shape, which resembles an upside-down silhouette of a person's head and shoulders. When properly formed and confirmed, this pattern indicates that selling pressure is diminishing and buying interest is beginning to emerge, suggesting a potential shift in market sentiment from bearish to bullish.
Anatomy of the Pattern
The inverse head and shoulders pattern consists of several critical components that traders must understand to identify and trade it effectively. The left shoulder forms first, representing an initial attempt by buyers to halt the downtrend. Prices decline to a low point, then rally back toward a resistance level. This creates the first trough of the pattern, establishing what will become the left shoulder.
Following the left shoulder, the head forms when prices decline again, this time to a level significantly lower than the left shoulder. This represents the deepest point of the selling pressure and often coincides with maximum bearish sentiment. After reaching this low, prices rally once again toward the same resistance level that capped the previous rally.
The right shoulder completes the formation when prices decline for a third time, but fail to reach the low established by the head. Instead, they find support at a level roughly equal to the left shoulder, creating the final trough of the pattern. This failure to make a new low is a crucial signal that the downtrend is losing momentum.
Connecting the peaks between the three troughs creates the neckline, which serves as a critical resistance level. This line can be horizontal, but more commonly slopes slightly upward or downward. The neckline represents the final barrier that prices must overcome to confirm the pattern and signal the start of a new uptrend.
The Psychology Behind the Pattern
Understanding the market psychology that creates the inverse head and shoulders pattern provides valuable insight into why it works as a reversal signal. During the formation of the left shoulder, initial buying interest emerges after a prolonged decline, but sellers quickly reassert control, pushing prices lower.
The head formation represents the climax of selling pressure. Bears make one final push lower, but this effort exhausts their momentum. The subsequent rally from the head often shows increased buying volume, indicating that buyers are becoming more aggressive.
When the right shoulder forms, the failure to reach new lows demonstrates that sellers can no longer drive prices to previous depths. This creates a higher low, which is a fundamental characteristic of an emerging uptrend. The inability of bears to maintain downward momentum signals a shift in the balance between buyers and sellers.
Volume Confirmation
Volume plays a crucial role in validating the inverse head and shoulders pattern. During the pattern's formation, volume typically diminishes as the pattern develops, reflecting decreasing interest from both buyers and sellers. However, the most critical volume signal occurs during the neckline breakout.
A legitimate breakout above the neckline should be accompanied by a significant increase in trading volume. This surge in volume confirms that the breakout is genuine and not a false signal. Without this volume confirmation, traders should be cautious about the pattern's validity, as low-volume breakouts often lead to failed reversals.
Volume analysis should also consider the individual components of the pattern. Ideally, volume should be highest during the formation of the left shoulder, moderate during the head formation, and lowest during the right shoulder. This declining volume pattern reflects diminishing selling pressure and supports the reversal thesis.
How to Trade the Inverse Head and Shoulders Pattern
Successfully trading the inverse head and shoulders pattern requires a systematic approach that combines pattern recognition with proper risk management techniques. The most common entry strategy involves waiting for a confirmed breakout above the neckline. This breakout serves as the trigger signal that the pattern is complete and the reversal is underway.
Traders typically enter long positions when the price closes decisively above the neckline, preferably on increased volume. Some traders prefer to wait for a slight pullback to the neckline after the initial breakout, using this retest as a lower-risk entry point. This approach allows for tighter stop-loss placement while still capitalizing on the pattern's bullish implications.
Setting Stop-Loss Levels
Proper risk management is essential when trading the inverse head and shoulders pattern. The most common stop-loss placement is below the right shoulder, as a break below this level would invalidate the pattern and suggest that the downtrend may continue. Some conservative traders prefer to place their stop-loss below the head, which provides additional protection but results in a wider stop distance.
The choice of stop-loss placement depends on individual risk tolerance and market conditions. In volatile markets, placing the stop below the head may be prudent, while in more stable conditions, a stop below the right shoulder may suffice. Regardless of the specific placement, having a predetermined stop-loss level is crucial for protecting capital if the pattern fails.
Calculating Price Targets
One of the advantages of the inverse head and shoulders pattern is that it provides a systematic method for calculating profit targets. The most widely used technique involves measuring the vertical distance from the head to the neckline, then adding this distance to the breakout point on the neckline.
For example, if the head reaches a low of $50 and the neckline is at $60, the pattern height is $10. If the breakout occurs at $62 (assuming a slightly upward-sloping neckline), the price target would be $72 ($62 + $10). This calculation provides a reasonable expectation for the minimum upward move following pattern completion.
It's important to note that price targets are not guarantees, but rather statistical probabilities based on historical pattern performance. Markets may exceed these targets during strong trending periods or fall short during weaker market conditions. Traders should use these targets as guidelines while remaining flexible and responsive to changing market dynamics.
Timeframes and Reliability
The inverse head and shoulders pattern can appear across all timeframes, from intraday charts to monthly charts. Generally, patterns that form over longer timeframes are considered more reliable and significant than those appearing on shorter timeframes. A pattern that develops over several months carries more weight than one that forms over a few days.
The reliability of the pattern also depends on the preceding downtrend's duration and magnitude. Patterns that form after significant, prolonged declines tend to be more reliable than those appearing after minor pullbacks. This is because substantial downtrends create the conditions necessary for meaningful reversals, while shallow corrections may not generate sufficient momentum for sustained upward moves.
Common Variations and Considerations
While the textbook inverse head and shoulders pattern features symmetric shoulders and a clear neckline, real-world formations often display variations. Asymmetric shoulders are common, with one shoulder being slightly deeper or wider than the other. These variations don't necessarily invalidate the pattern, but traders should use discretion when evaluating such formations.
The neckline may also vary from the ideal horizontal line. Upward-sloping necklines are generally considered more bullish, as they indicate increasing buying pressure during the pattern's formation. Downward-sloping necklines may suggest weaker underlying momentum and should be viewed with additional caution.
Integration with Other Technical Tools
While the inverse head and shoulders pattern is powerful on its own, combining it with other technical analysis tools can enhance trading effectiveness. Moving averages can provide additional context for the overall trend, while momentum indicators like the Relative Strength Index (RSI) or MACD can help confirm the pattern's signals.
Support and resistance levels from previous price action can also influence the pattern's effectiveness. If the neckline coincides with a significant resistance level from prior trading activity, the breakout becomes even more meaningful. Conversely, if there's little historical significance to the neckline level, the pattern may be less reliable.
Risk Factors and Limitations
Despite its reputation as a reliable reversal pattern, the inverse head and shoulders formation is not foolproof. False breakouts can occur, particularly in volatile or low-volume market conditions. These fake-outs can trap traders who enter positions too aggressively without proper confirmation.
Market conditions also play a significant role in pattern success. During strong bear markets or periods of high uncertainty, even well-formed reversal patterns may fail as selling pressure overwhelms buying interest. Traders should consider the broader market context when evaluating individual patterns.
The subjective nature of pattern identification presents another challenge. Different traders may draw necklines differently or have varying interpretations of what constitutes a proper shoulder formation. This subjectivity can lead to inconsistent results and emphasizes the importance of having clear, predetermined criteria for pattern recognition.
Real-World Applications
Successful application of the inverse head and shoulders pattern requires patience and discipline. Traders must wait for complete pattern formation before taking action, as incomplete patterns provide no reliable signals. Rushing into positions based on partial formations often leads to poor results and unnecessary losses.
The pattern works across various financial instruments, including stocks, forex pairs, commodities, and indices. In forex trading, the pattern can be particularly effective for identifying major trend reversals in currency pairs, especially when combined with fundamental analysis and central bank policy considerations.
Conclusion
The inverse head and shoulders pattern represents one of technical analysis's most valuable tools for identifying bullish trend reversals. Its clear structure, definable risk parameters, and systematic approach to profit targets make it an excellent addition to any trader's analytical toolkit. However, like all technical patterns, it should be used in conjunction with proper risk management and other analytical tools to maximize effectiveness.
Success with this pattern requires patience to wait for complete formation, discipline to follow predetermined entry and exit rules, and the wisdom to consider broader market context. When these elements align with a well-formed inverse head and shoulders pattern, traders can position themselves to capitalize on significant trend reversals and potentially substantial profit opportunities.
Understanding and mastering this pattern takes time and practice, but the effort invested in learning its nuances can pay substantial dividends in improved trading performance. Whether you're a novice trader or an experienced professional, the inverse head and shoulders pattern deserves a prominent place in your technical analysis arsenal.